July 2026: −3.31%, and a currency trend that turned
Live, real-capital, fully systematic. Live track record → · Methodology →
July lost 3.31%. Currencies did almost all of the damage, and a single position, a short Swedish krona held unchanged from the first day of the month to the last, cost more than a percent of it in the final three days.
The numbers
| This month | YTD | Since inception | |
|---|---|---|---|
| Return | −3.31% | +43.92% | +40.65% |
| Sharpe (ann.) | −1.44 | +2.26 | +1.82 |
| Max drawdown in window (worst peak-to-trough) | −5.92% | −8.42% | −8.42% |
| Hit rate (daily) | 47.8% | 61.6% | 58.9% |
| Drawdown at month-end (vs all-time high) | −4.7% from peak |
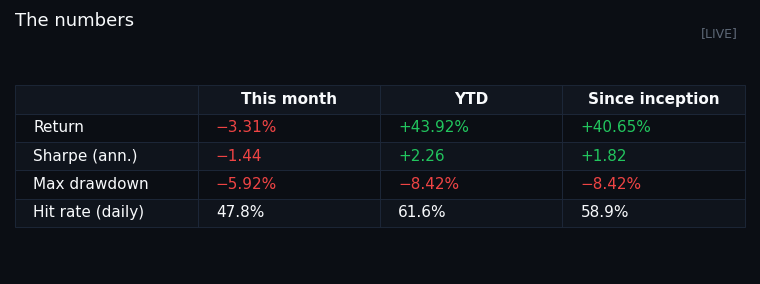
Note 1 · Monthly and YTD Sharpe are sampling noise at this length. Only the since-inception figure has a real sample behind it.
Note 2 · The return line is the broker's own time-weighted figure; the risk statistics beside it come from our daily series. The two agree for July.
Return, before and after costs
As a percentage of start-of-month capital, broken down the way Rob Carver reports his: mark-to-market before costs, then the costs themselves, then net.
| Line | % of capital |
|---|---|
| Mark-to-market (pre-cost) | −4.13% |
| Commissions | −0.08% |
| Slippage | +0.90% |
| Net | −3.31% |
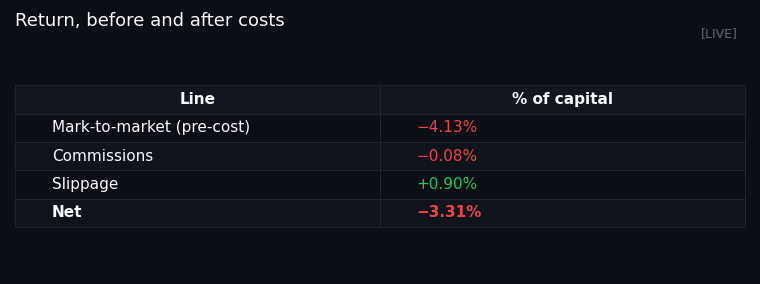
Note 3 · Costs are estimated against opening capital. Interest and platform fees are not tracked separately.
Note 4 · The +0.90% slippage is a broken measurement, not an execution edge. Delayed market data is the likely cause.
Time series
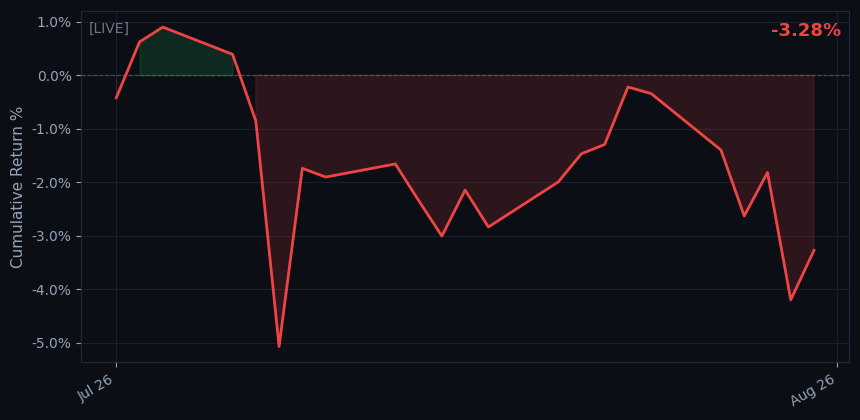
The month, day by day:
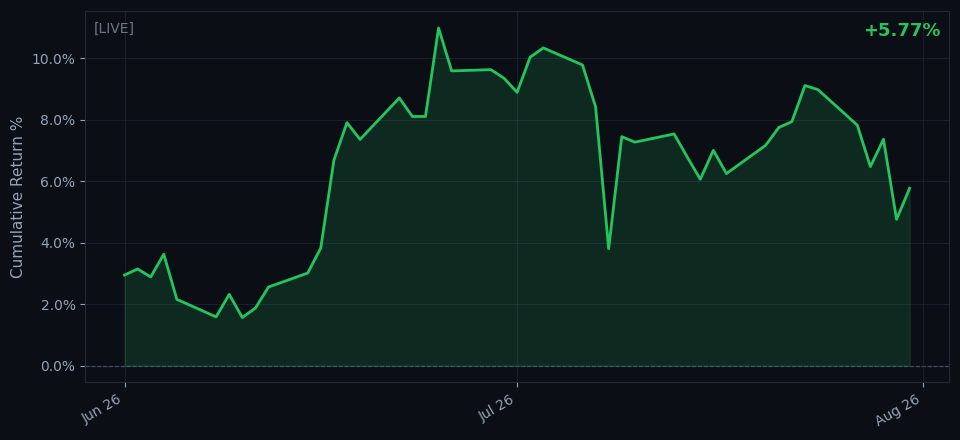
And the last couple of months for context:
Benchmarks
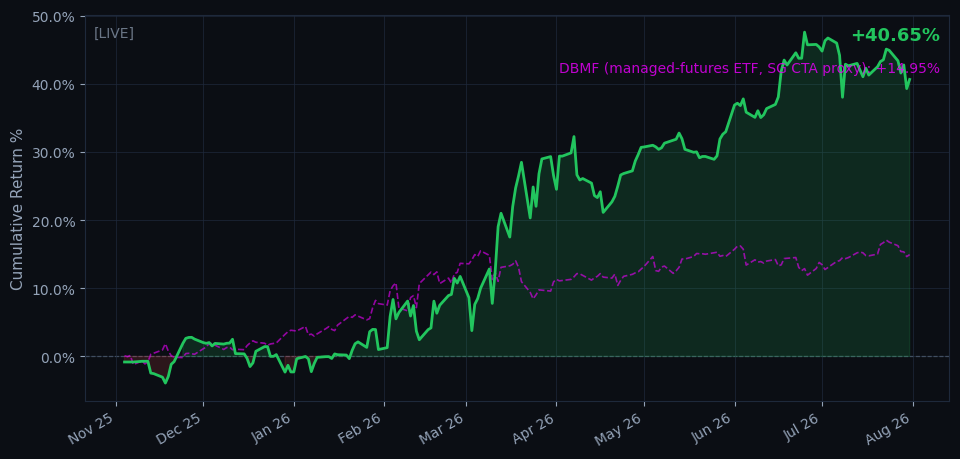
There is no freely published SG CTA Index, so the benchmark here is a liquid managed-futures ETF used as a transparent proxy.
| Since inception (live) | Strategy | DBMF (managed-futures ETF, SG CTA proxy) |
|---|---|---|
| Return (cumulative) | +40.7% | +14.8% |
| Volatility (annualised) | 26.4% (vs 25% target) | 12.4% |
| Sharpe (ann., rf=0) | +1.86 | +1.52 |
| Correlation to benchmark | 0.07 | — |
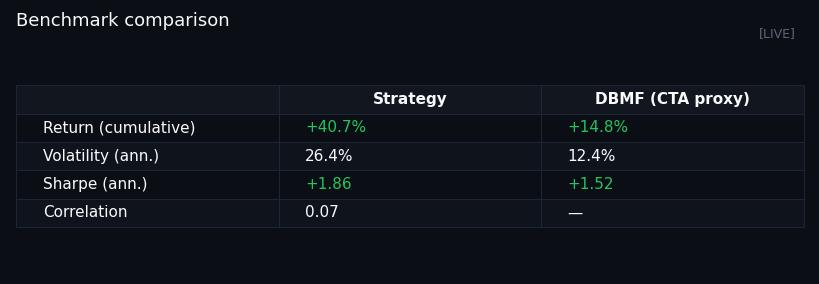
Note 5 · Risk-adjusted, the strategy and the proxy are close. The gap in cumulative return is extra volatility, not extra skill.
Market by market
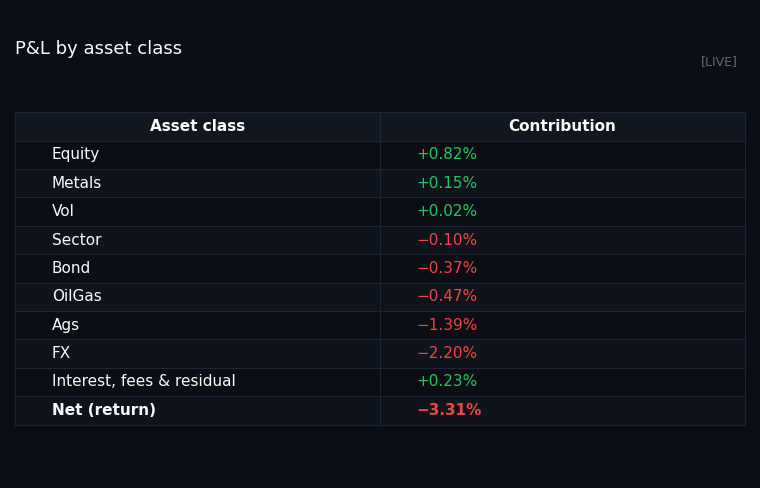
P&L by asset class this month, from the broker's own settlement marks (Interactive Brokers Flex). It reconciles to the headline return; the bridge line carries interest, fees, financing and the small residual between the broker's per-instrument marks and its account-level return:
| Asset class | Contribution |
|---|---|
| Equity | +0.82% |
| Metals | +0.15% |
| Vol | +0.02% |
| Sector | −0.10% |
| Bond | −0.37% |
| OilGas | −0.47% |
| Ags | −1.39% |
| FX | −2.20% |
| Interest, fees & residual | +0.23% |
| Net (return) | −3.31% |
Top contributors
- RSV — +0.99% (Equity). Forecast driven mainly by the skewrv180 and relmomentum40 rules.
- ZB — +0.40% (Bond). Forecast driven mainly by the assettrend2 and assettrend4 rules.
- SX7P — +0.34% (Equity). Forecast driven mainly by the mrinasset1000 and assettrend16 rules.
- ZT — +0.30% (Bond). Forecast driven mainly by the assettrend2 and assettrend4 rules.
- QM — +0.29% (OilGas). Forecast driven mainly by the relcarry and mrinasset1000 rules.
Worst contributors
- SEK — −1.05% (FX).
- RB — −0.99% (OilGas). Forecast driven mainly by the assettrend2 and normmom8 rules.
- ZL — −0.77% (Ags). Forecast driven mainly by the assettrend4 and relmomentum80 rules.
- GBX — −0.48% (Bond). Forecast driven mainly by the assettrend2 and mrinasset1000 rules.
- UB — −0.41% (Bond).
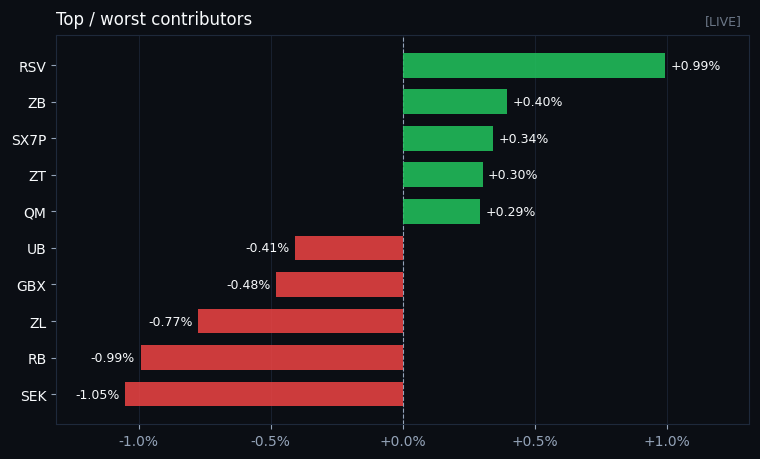
Asset class attribution: currencies were the month. FX lost 2.20% across thirteen pairs, ten of which were negative, and that breadth is the point: this was a currency trend reversing across the whole book rather than one position going wrong, even though short Swedish krona at −1.05% was the largest single loser. Agriculturals cost another 1.39%, mostly soybean oil at −0.77%. Energy cost 0.47% net, where a losing gasoline position at −0.99% was partly covered by +0.58% made in crude. Bonds netted −0.37% with the book on opposite sides of the long end: US two-year and thirty-year positions made money while the German Buxl, the US Ultra bond and JGBs lost it. Equities were the only real offset at +0.82%, led by Russell 1000 futures at +0.99%, the same contract whose slippage numbers are the subject of Note 4. Those are two different measurements of the same trades, and only the P&L one comes from the broker. 59 instruments produced non-zero contribution this month.
A few markets up close
Price, position and cumulative P&L for the month's biggest movers — the kind of "nice trading / got chopped up" look Carver does market by market.
SEK
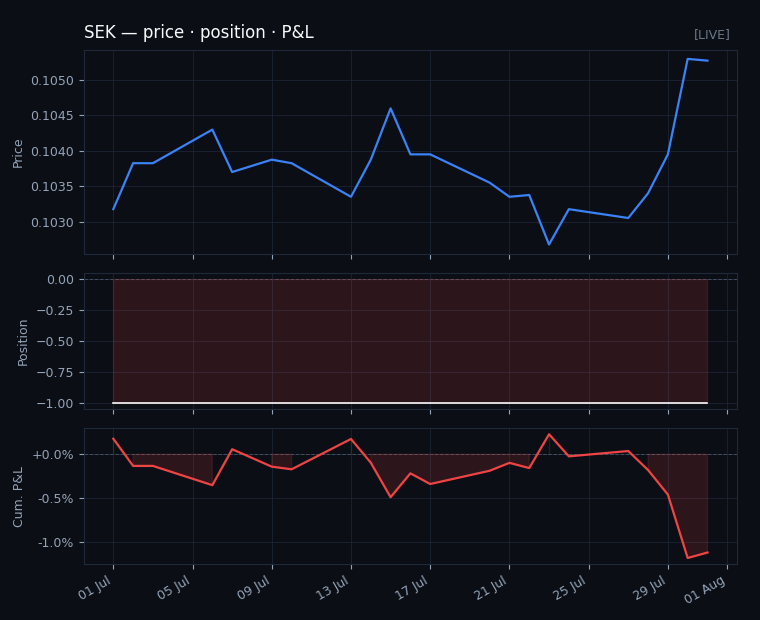
The position is the flat line in the middle panel: short one contract, unchanged from 1 July to 31 July. The krona chopped sideways for four weeks and the trade sat at roughly break-even the whole time. Then the currency rallied about 2% in the last three sessions and the entire month's loss arrived at once. This is the ordinary way a trend position loses money. There is no bad fill, no data problem and nothing to fix; a trend that had been paying stopped paying, and the system will not reduce the position until its own signals turn.
How the rules performed
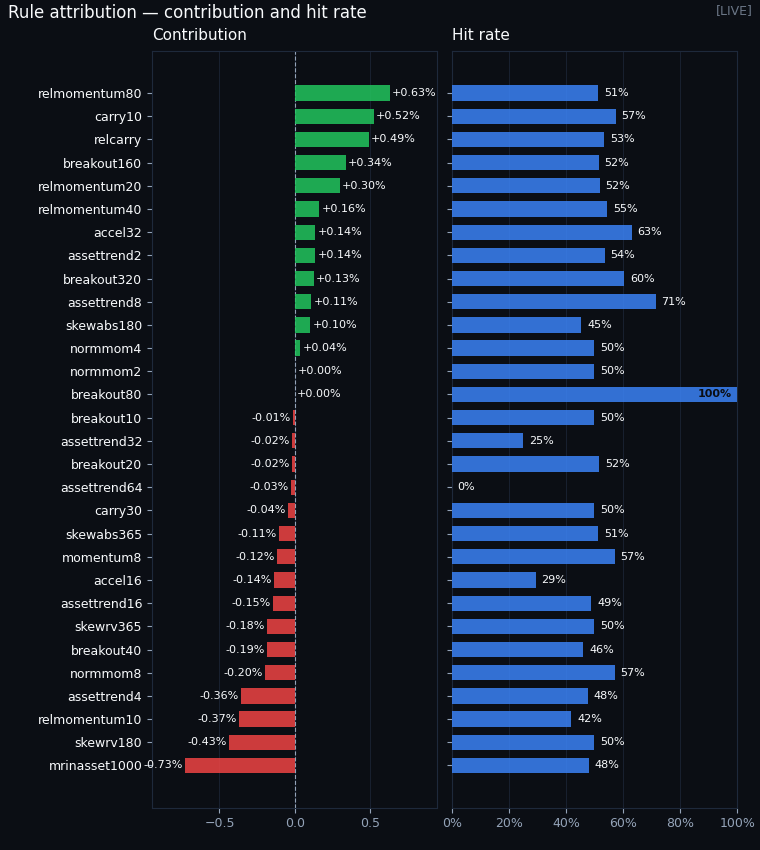
Live rule-family attribution for the month:
| Rule family | Contribution | Hit rate |
|---|---|---|
| relmomentum80 | +0.63% | 51% |
| carry10 | +0.52% | 57% |
| relcarry | +0.49% | 53% |
| breakout160 | +0.34% | 52% |
| relmomentum20 | +0.30% | 52% |
| relmomentum40 | +0.16% | 55% |
| accel32 | +0.14% | 63% |
| assettrend2 | +0.14% | 54% |
| breakout320 | +0.13% | 60% |
| assettrend8 | +0.11% | 71% |
| skewabs180 | +0.10% | 45% |
| normmom4 | +0.04% | 50% |
| normmom2 | +0.00% | 50% |
| breakout80 | +0.00% | 100% |
| breakout10 | −0.01% | 50% |
| assettrend32 | −0.02% | 25% |
| breakout20 | −0.02% | 52% |
| assettrend64 | −0.03% | 0% |
| carry30 | −0.04% | 50% |
| skewabs365 | −0.11% | 51% |
| momentum8 | −0.12% | 57% |
| accel16 | −0.14% | 29% |
| assettrend16 | −0.15% | 49% |
| skewrv365 | −0.18% | 50% |
| breakout40 | −0.19% | 46% |
| normmom8 | −0.20% | 57% |
| assettrend4 | −0.36% | 48% |
| relmomentum10 | −0.37% | 42% |
| skewrv180 | −0.43% | 50% |
| mrinasset1000 | −0.73% | 48% |
Note 6 · Rule attribution is gross of costs and computed on a forecast-attributed basis, so the column does not sum to the net return.
What changed
Several things, none of them a change to the trading rules or the risk target.
Execution moved to delayed market data (8 July). The bill this actually retired was small: market data for this account had been running about 80 dollars a month, which the broker's own fee line for July confirms. The number that drove the decision is the one I did not pay. The previous execution algorithm works the order book locally, so it needs a live quote stream, and real-time futures data across the two dozen exchanges this universe touches runs to roughly 1,600 dollars a month at professional subscriber rates. That is about 5.7% of this account per year, against 0.28% for what was actually being paid. Continuing down the real-time path meant accepting the larger number, so instead the execution algorithm was switched to one that pegs to the midpoint on the broker's side and never asks for a live book, and the remaining subscriptions were cancelled on 22 July. Sampling and position sizing already ran on delayed prices. The costs are that fill quality is now harder to measure, as the slippage section above shows, and that a market whose delayed feed does not publish both a bid and an ask can have an order silently skipped. Alerting for that case went in with the same change. This is a cost decision with an execution-quality risk attached, and I will keep reporting on it rather than assume it was free.
Seven instruments were pulled out of the tradable universe on data-quality grounds. Six went on 4 July after a census of 222 instruments for extreme vol-scaled moves, staleness and split price bases: unit breaks, a mapping that merged two different indices, and similar. The seventh, on 20 July, is the one worth describing. Dutch TTF gas was configured with a point size of 1 while the broker's multiplier for the same contract is 720, so the system valued a lot at about 60 euros against the broker's 42,900. The optimiser was therefore scoring what is really a 14%-of-capital holding as 0.02% of capital, and nothing in the sizing logic would have rejected it: the optimiser adds a contract whenever doing so improves its objective, and an understated contract value just makes an instrument look like the finest-grained step available. The instrument was never traded, but the reason it was never traded is that its portfolio weight happened to be 0.0001, and a small weight lowers the odds of taking a position without capping its size. That is luck, not a control. The cost filter that should have caught the discrepancy could not fire either, because the same instrument also had zero configured commission. A consistency check across all 511 instruments found exactly two mismatches of this kind, and it now runs as a test. Aluminium on the LME went the other way and was brought back in after its mapping was corrected.
The daily return series now nets capital movements instead of dropping the day, and the published record has been restated downward. A day carrying money into or out of the account used to be recorded as flat. That kept the cash out of performance, which was the point, but it also threw away whatever the strategy did on that day, and deleting a day can only ever flatter a record when the deleted day was a losing one. Netting the movement out of the day's account change, and keeping the trading result underneath it, moves the since-inception figure from +42.16% to +40.65% and the year-to-date figure from +45.47% to +43.92%. Those corrected numbers are the ones in the table at the top of this post. Three days remain recorded as flat: the account's opening deposits, each of which was larger than the account receiving it, where no honest same-day return can be reconstructed. The fix ships with tests, and any future month carrying a cash movement is now flagged when the report is generated.
The contract-roll engine was fixed twice (21 and 22 July), once to make automatic rolls respect their configured roll dates and once to recover a roll left stranded halfway through by a crash. Both were found by monitoring rather than by a bad fill, and neither shows up in the month's P&L.
Current positioning
- Annualised portfolio risk: 18.9%
- Margin usage: 23.1%
Costs and slippage
All-in trading cost this month was −0.08% commissions and +0.90% slippage. Slippage is signed so that a positive number means price improvement versus the decision price; a negative figure is a cost (spread and market impact paid).
Commissions of 0.08% on 198 fills are real and measured from broker cash. The slippage figure is not trustworthy this month, for the reasons set out in Note 4, and should be read as an unknown rather than as a gain.
Looking forward
Nothing about the system changes because of a losing month. The rules, the weights and the 25% volatility target are the same on 1 August as they were on 1 July, and a 3.31% loss is well inside the range this account is built to produce: realised volatility since inception is 26.4% annualised, which puts a month like this at well under one standard deviation.
One comparison is worth sitting with rather than explaining away. The managed-futures ETF used here as a proxy returned about +1.01% in July while this account lost 3.31%, so this was not a month where trend following as a whole was punished. The correlation between the two since inception is 0.07, and a book that genuinely diversifies a CTA allocation will lose in months when the CTA index gains. That is the deal working as intended, but it is only a good deal if the average is positive over a long enough sample, and nine months of live history is nowhere near long enough to claim that.
One open item carries into August: the slippage measurement under delayed market data, which has to be fixed before any cost number from July onward means anything. The broker's own execution report is the obvious independent check.
Notes
The full text of each note, kept in full for the record.
1. The monthly and YTD Sharpe figures are annualised from very few observations (≈21 trading days in a single month) and are dominated by sampling noise — read them as directional, not as estimates; the since-inception figure is the only one with a meaningful sample. The since-inception Sharpe here is computed on the full strategy-native daily series, while the value in the Benchmarks section below uses the narrower benchmark-overlap window, which is why the two differ. A daily hit rate near or below 50% is normal for a trend system: it is right on a minority of days and still profits because winning days are larger than losing ones.
2. A note on the two bases in that table. The return line is the broker's own time-weighted figure, calculated by Interactive Brokers from its records. The Sharpe, drawdown and hit-rate figures next to it are computed from our daily series, built from end-of-day account values. The two agree to within about three hundredths of a point for July, so nothing here turns on which one you read. The shape of the month is worth knowing before reading the risk statistics: 8 July alone cost 4.3% and 9 July gave 3.5% of it straight back, and that pair drives most of the −5.92% monthly drawdown figure.
3. Costs are estimated and expressed as a simple percentage of start-of-month capital, so they need not tie exactly to the compounded net return. Interest and platform fees are not tracked separately and are not shown.
4. A second note on that positive slippage line, because last month's explanation turned out to be incomplete. A trend follower pays the spread, it does not earn it, so +0.90% of slippage is not an execution edge. June's report blamed a broker "no quote" value being read as though it were a real price, and that bug was fixed on 19 June. July is the first full month after the fix and the number went up rather than down, so something else is going on. Most of the +0.90% is three fills in one instrument, Russell 1000 futures, claiming 12, 14 and 20 index points of improvement, on a buy and on two sells. A real spread cannot pay you in both directions.
The likely cause is a change described under "What changed" above. This account moved to delayed market data on 8 July, which makes the reference price a fill is scored against up to fifteen minutes stale. The measurement bears that out: average absolute slippage per fill ran between 2.8 and 3.6 basis points in every month from March to June, then 8.3 basis points over the rest of July against 3.6 basis points in the three weeks before the switch. Execution did not become twice as erratic overnight; the yardstick did. That is a hypothesis with supporting evidence rather than a confirmed diagnosis, and it is now the open item. The −3.31% net return comes from the broker's own account value and not from this estimate, so the headline is unaffected either way. Only the decomposition above is, and the mark-to-market line carries the same error with the opposite sign.
5. On a risk-adjusted basis the strategy and the proxy are close — compare the two Sharpe figures above — so the higher cumulative return reflects the strategy's higher volatility, not higher skill in this window. The strategy's realised volatility also runs above its own configured target. The genuine differentiator is the near-zero correlation (0.07): the strategy diversifies a managed-futures allocation rather than replicating it. Return is cumulative since the live track record began (it matches the chart above). Sharpe is shown with rf=0; deducting a risk-free rate would lower both figures.
6. Rule attribution is gross of costs and computed on a forecast-attributed basis — a different decomposition from the net return at the top of this post — so the column does not sum to the net figure.
Past performance does not guarantee future results. Net of estimated transaction costs. Returns are time-weighted and adjusted for capital additions and withdrawals. The account shown is the operator's own (proprietary) capital. Benchmark is a managed-futures ETF used as a proxy, not the SG CTA Index. Full methodology and disclaimers on the live dashboard.
Plaintape LLC is registered with the CFTC as a Commodity Trading Advisor (NFA ID 0580378) and its NFA membership application is pending. The firm is not yet accepting client accounts. Registration does not imply that the CFTC or NFA has approved or endorsed the firm, its trading program, or the material on this site. Registration-status note added 2026-08-09; it describes the firm's status today, not its status during the period reported above.