May 2026: +1.76%, a steady FX-led month at fresh highs
Live, real-capital, fully systematic. Live track record → · Methodology →
The numbers
| This month | YTD | Since inception | |
|---|---|---|---|
| Return | +1.76% | +36.07% | +32.97% |
| Sharpe (ann.) | +2.19 | +2.49 | +1.88 |
| Max drawdown in window (worst peak-to-trough) | −2.90% | −8.42% | −8.42% |
| Hit rate (daily) | 66.7% | 64.2% | 60.0% |
| Drawdown at month-end (vs all-time high) | 0.0% from peak |
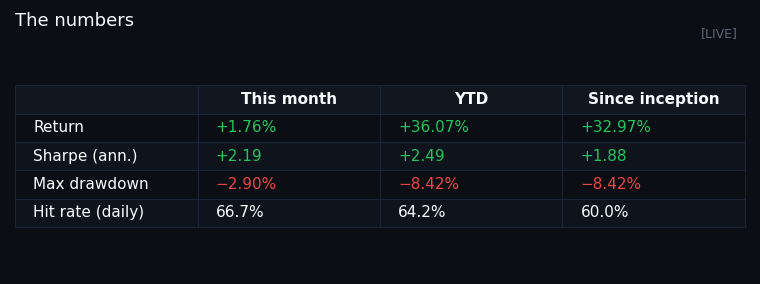
The monthly and YTD Sharpe figures are annualised from very few observations (≈21 trading days in a single month) and are dominated by sampling noise — read them as directional, not as estimates; the since-inception figure is the only one with a meaningful sample. The since-inception Sharpe here is computed on the full strategy-native daily series, while the value in the Benchmarks section below uses the narrower benchmark-overlap window, which is why the two differ. A daily hit rate near or below 50% is normal for a trend system: it is right on a minority of days and still profits because winning days are larger than losing ones.
Return, before and after costs
As a percentage of start-of-month capital, broken down the way Rob Carver reports his: mark-to-market before costs, then the costs themselves, then net.
| Line | % of capital |
|---|---|
| Mark-to-market (pre-cost) | +2.20% |
| Commissions | −0.08% |
| Slippage | −0.37% |
| Net | +1.76% |
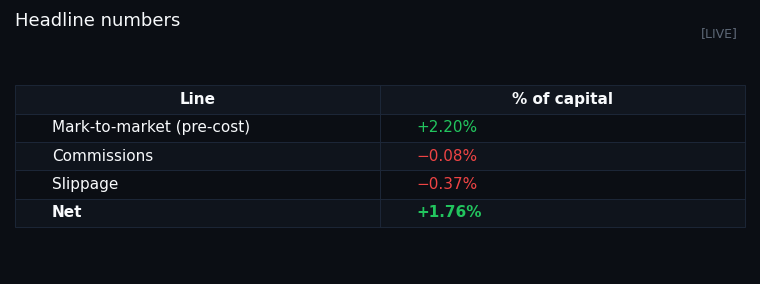
Costs are estimated and expressed as a simple percentage of start-of-month capital, so they need not tie exactly to the compounded net return. Interest and platform fees are not tracked separately and are not shown.
Time series
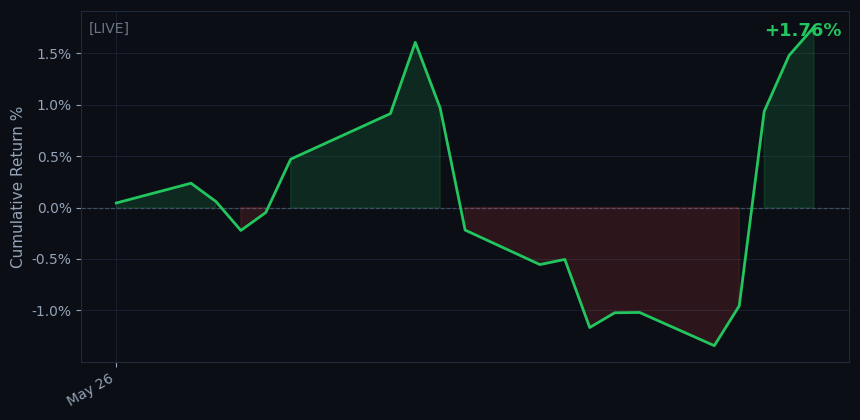
The month, day by day:
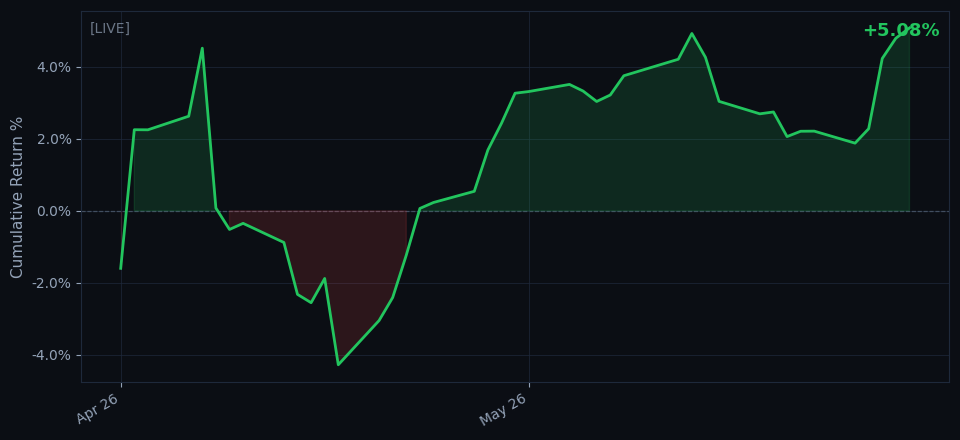
And the last couple of months for context:
Benchmarks
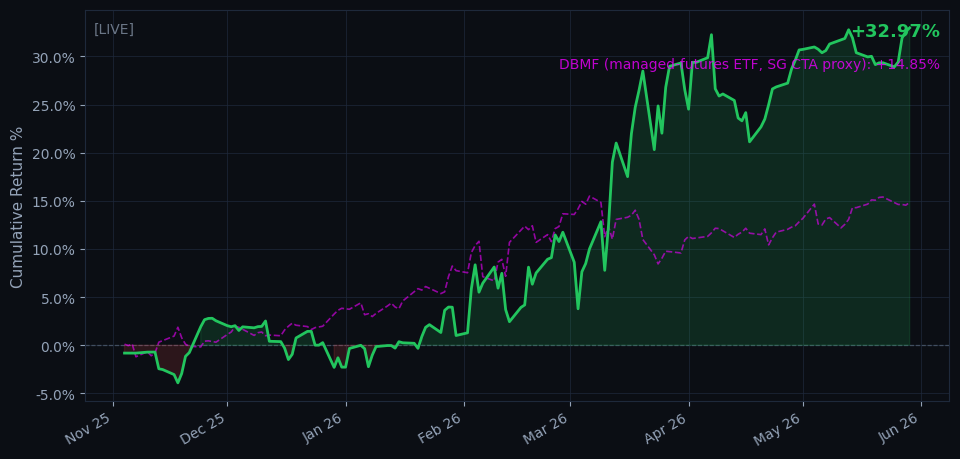
There is no freely published SG CTA Index, so the benchmark here is a liquid managed-futures ETF used as a transparent proxy.
| Since inception (live) | Strategy | DBMF (managed-futures ETF, SG CTA proxy) |
|---|---|---|
| Return (cumulative) | +33.0% | +14.7% |
| Volatility (annualised) | 27.7% (vs 25% target) | 13.1% |
| Sharpe (ann., rf=0) | +1.94 | +1.85 |
| Correlation to benchmark | 0.04 | — |
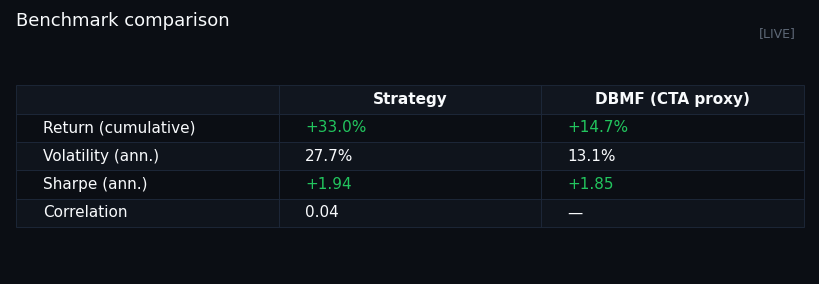
On a risk-adjusted basis the strategy and the proxy are close — compare the two Sharpe figures above — so the higher cumulative return reflects the strategy's higher volatility, not higher skill in this window. The strategy's realised volatility also runs above its own configured target. The genuine differentiator is the near-zero correlation (0.04): the strategy diversifies a managed-futures allocation rather than replicating it. Return is cumulative since the live track record began (it matches the chart above). Sharpe is shown with rf=0; deducting a risk-free rate would lower both figures.
Market by market
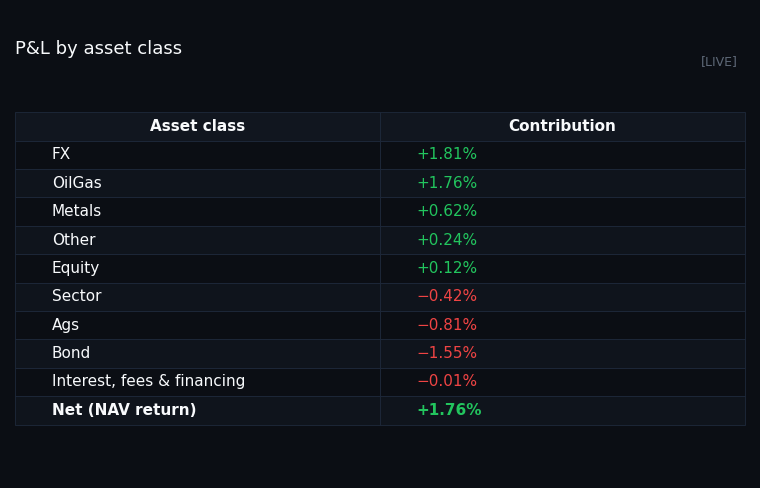
P&L by asset class this month, from the broker's own settlement marks (Interactive Brokers Flex). It reconciles to the headline NAV return; the bridge line is just interest and fees:
| Asset class | Contribution |
|---|---|
| FX | +1.81% |
| OilGas | +1.76% |
| Metals | +0.62% |
| Other | +0.24% |
| Equity | +0.12% |
| Sector | −0.42% |
| Ags | −0.81% |
| Bond | −1.55% |
| Interest, fees & financing | −0.01% |
| Net (NAV return) | +1.76% |
Top contributors
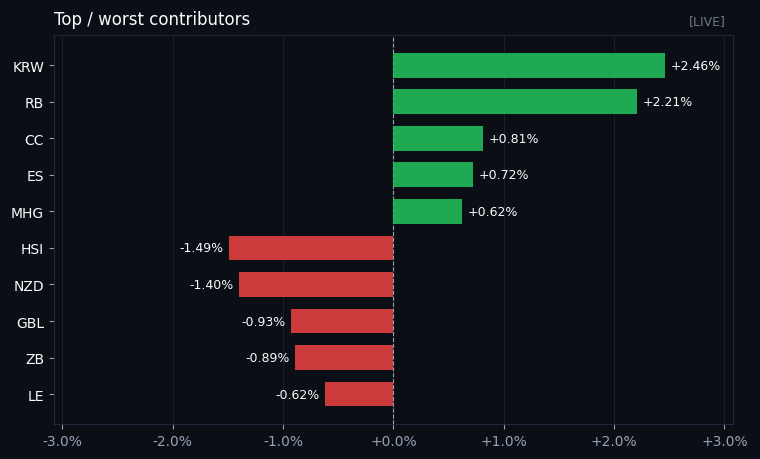
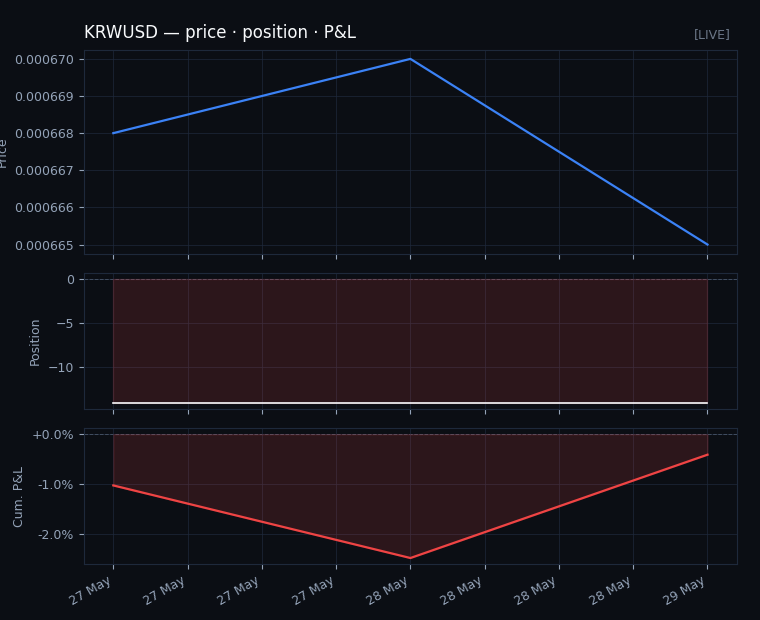
- KRW — +2.46% (FX).
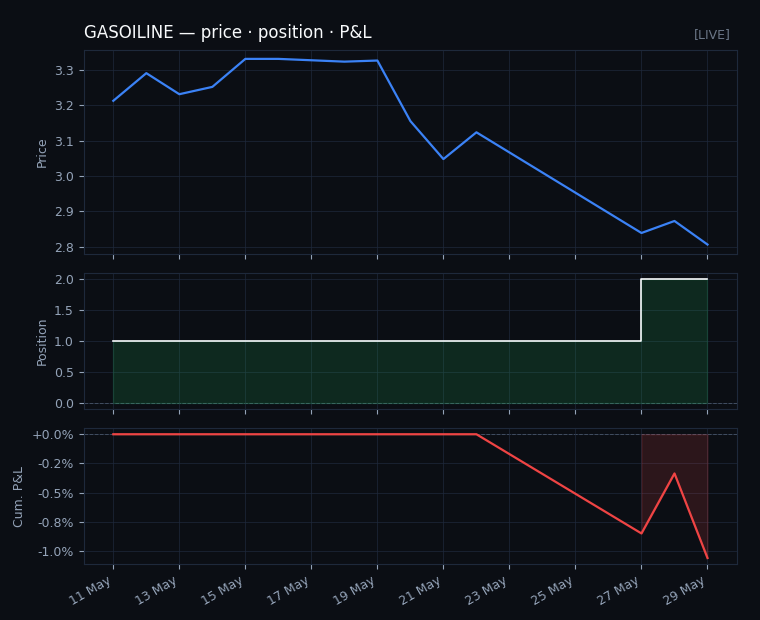
- RB — +2.21% (OilGas). Forecast driven mainly by the relcarry and carry10 rules.
- CC — +0.81% (Ags). Forecast driven mainly by the mrinasset1000 and relmomentum80 rules.
- ES — +0.72% (Equity).
- MHG — +0.62% (Metals). Forecast driven mainly by the skewabs365 and skewrv365 rules.
Worst contributors
- HSI — −1.49% (Equity). Forecast driven mainly by the mrinasset1000 and skewabs365 rules.
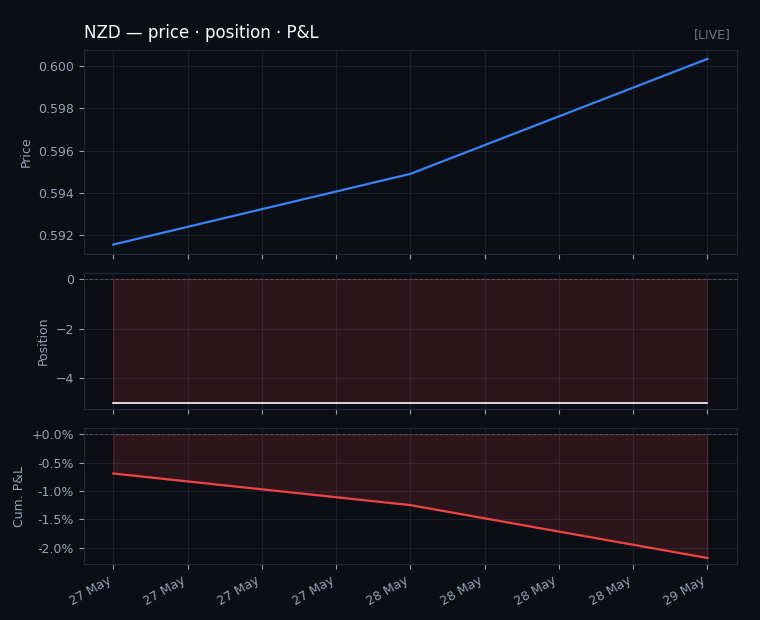
- NZD — −1.40% (FX). Forecast driven mainly by the mrinasset1000 and carry125 rules.
- GBL — −0.93% (Bond). Forecast driven mainly by the assettrend2 and assettrend4 rules.
- ZB — −0.89% (Bond). Forecast driven mainly by the assettrend2 and assettrend4 rules.
- LE — −0.62% (Ags). Forecast driven mainly by the mrinasset1000 and carry125 rules.
Asset class attribution: FX led the month (+1.81%), with energy (+1.76%) and metals (+0.62%) adding; bonds (−1.55%) and agriculturals (−0.81%) were the main drags. 51 instruments produced non-zero contribution this month.
A few markets up close
Price, position and cumulative P&L for the month's biggest movers — the kind of "nice trading / got chopped up" look Carver does market by market.
NZD
KRWUSD
GASOILINE
How the rules performed
Corrected 3 October 2026. The rule table and chart in this section were first published with a sign error. When the system was short a market, every rule behind that position was booked with the inverse of the market's P&L, so a short that made money showed its rules losing. The figures below are recomputed from the same daily log with the sign fixed. The same error sat behind one sentence in the asset-class attribution above, which said the agricultural loss was largely the mean-reversion rules giving back. With the sign fixed, the mean-reversion rules made 0.41% in agriculturals, so that clause is removed. Nothing else in this post changed.
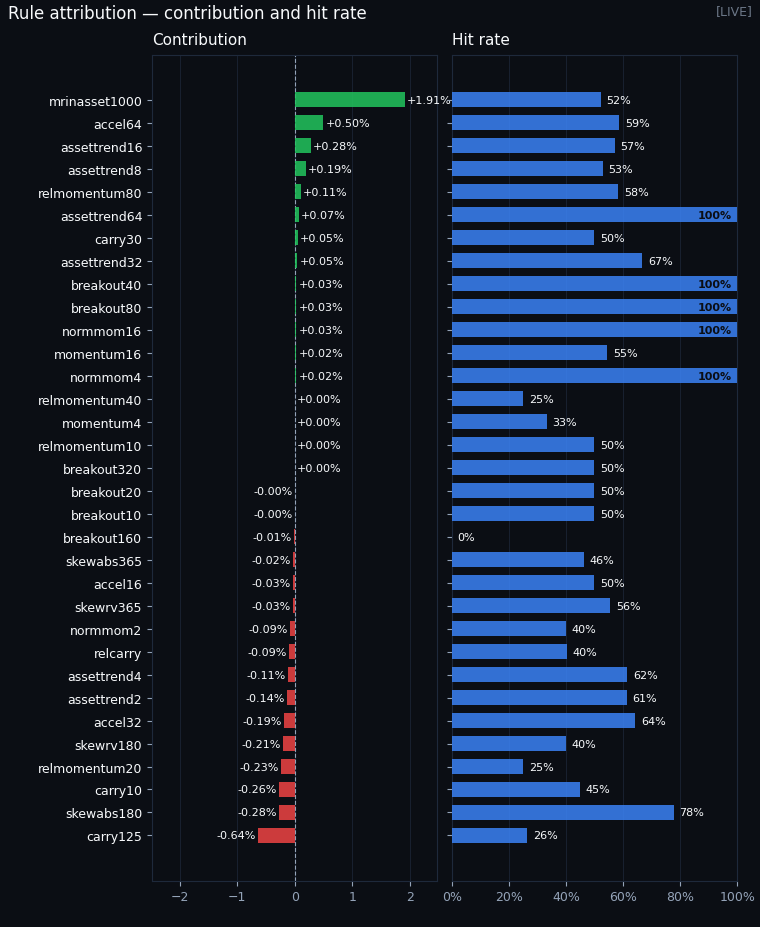
Each market's daily P&L is split among the three rules with the largest weighted forecast that day, and each share is signed by whether the rule pointed the same way as the position held. So this shows which rules were behind the positions held, not what each would have earned on its own. The log covers 15 of May's 21 trading days, 11 to 29 May. Over those days the rules sum to +0.95% and the account returned +1.28%.
Live rule-family attribution for the month:
| Rule family | Contribution | Hit rate |
|---|---|---|
| mrinasset1000 | +1.91% | 52% |
| accel64 | +0.50% | 59% |
| assettrend16 | +0.28% | 57% |
| assettrend8 | +0.19% | 53% |
| relmomentum80 | +0.11% | 58% |
| assettrend64 | +0.07% | 100% |
| carry30 | +0.05% | 50% |
| assettrend32 | +0.05% | 67% |
| breakout40 | +0.03% | 100% |
| breakout80 | +0.03% | 100% |
| normmom16 | +0.03% | 100% |
| momentum16 | +0.02% | 55% |
| normmom4 | +0.02% | 100% |
| relmomentum40 | +0.00% | 25% |
| momentum4 | +0.00% | 33% |
| relmomentum10 | +0.00% | 50% |
| breakout320 | +0.00% | 50% |
| breakout20 | −0.00% | 50% |
| breakout10 | −0.00% | 50% |
| breakout160 | −0.01% | 0% |
| skewabs365 | −0.02% | 46% |
| accel16 | −0.03% | 50% |
| skewrv365 | −0.03% | 56% |
| normmom2 | −0.09% | 40% |
| relcarry | −0.09% | 40% |
| assettrend4 | −0.11% | 62% |
| assettrend2 | −0.14% | 61% |
| accel32 | −0.19% | 64% |
| skewrv180 | −0.21% | 40% |
| relmomentum20 | −0.23% | 25% |
| carry10 | −0.26% | 45% |
| skewabs180 | −0.28% | 78% |
| carry125 | −0.64% | 26% |
Rule attribution is gross of costs and computed on a forecast-attributed basis — a different decomposition from the NAV return at the top of this post — so the column does not sum to the net figure.
What changed
-
Methodology: Instruments traded: 265 → 269 (+ALUMINIUM_LME, +CAD2, +GILT5, +MSCIEMASIA). Sampler skip list 0 → 7 (silencing CME-delisted, duplicate, and untraded markets). URANIUM deferred. All other parameters unchanged.
-
Operational: 1 event logged.
A note on risk, late May. In the last days of May, following the rapid expansion of the traded universe, a job failure left the system briefly carrying about three times its intended risk target for roughly a week. It was caught on 28 May and fixed, and the oversized positions were wound down through mid-June. Because it was detected and resolved in June, the full post-mortem (what happened, how it was caught, and the guardrails added) is in the June update.
Current positioning
- Annualised portfolio risk: —
- Margin usage: —
Costs and slippage
All-in trading cost this month was −0.08% commissions and −0.37% slippage. Slippage is signed so that a positive number means price improvement versus the decision price; a negative figure is a cost (spread and market impact paid).
Looking forward
The system continues to run unchanged across its full universe of markets; methodology and operational changes, when they happen, are logged in "What changed" above. The one material event this month, the late-May risk overshoot, is summarised there and covered in full in the June update. With automated risk-metric capture now live, the month-end positioning detail absent here resumes from June onward.
PAST PERFORMANCE IS NOT NECESSARILY INDICATIVE OF FUTURE RESULTS. Returns are calculated from broker-reported account values, so they reflect execution prices and any commissions, fees, financing charges, interest and currency effects included in those values. Cost breakdowns shown separately are estimates. These returns do not deduct advisory fees that would apply to a client account. The account shown is the operator's own (proprietary) capital. Benchmark is a managed-futures ETF used as a proxy, not the SG CTA Index. Full methodology and disclaimers on the live dashboard.
Plaintape LLC is registered with the CFTC as a Commodity Trading Advisor (NFA ID 0580378) and its NFA membership application is pending. The firm is not yet accepting client accounts. Registration does not imply that the CFTC or NFA has approved or endorsed the firm, its trading program, or the material on this site. Registration-status note added 2026-08-09; it describes the firm's status today, not its status during the period reported above.